.gif)
Value at Risk (VaR)
- Parametric, Historical, Monte Carlo and Others
- Individual, Portfolio, Component, or Custom Partitioning
- Confidence Levels
- Time Horizons
- Lookback Periods of 30 Days-5 Years
- Many Other Features
Stress Testing
Apply hypothetical shocks to understand portfolio behavior under extreme market conditions
- Spot, Volatility, and Scenario Analysis
- Single and Multiple Dimensional Shocks
- View your Actual Market Values Along Side Shocked Market Values
P&L and Exposure Analysis
Add VaR and Stress measurements to our existing array of P&L, open position, and exposure reporting.
- Market Value, Exposure, Realized and Unrealized Gains and Losses
- Single Day, Month to Date, Year to Date, Inception, or any Custom Date Range
- Breakdown of P&L by realized amounts, option premiums, trading costs, and other dimensions
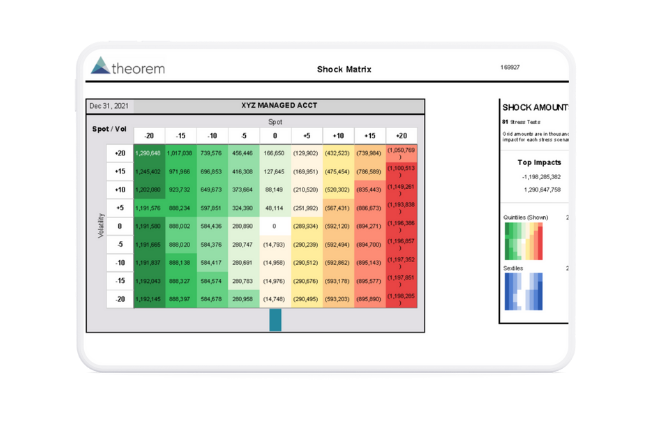
Multiple Shocks on One Report
See up to 144 stress tests on one report in our Shock Matrix that shows the impact with different volatility and spot shocks.
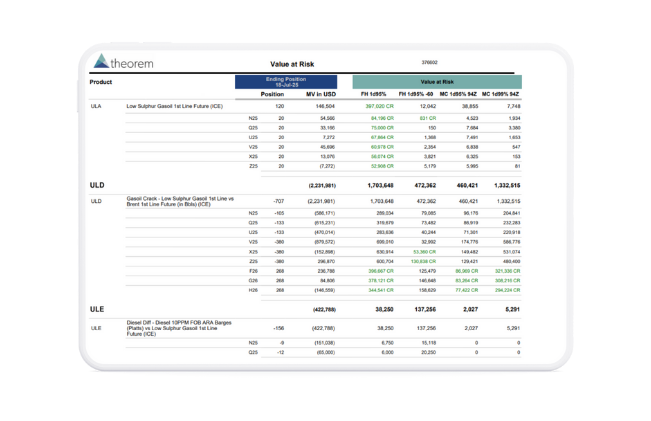
Component VaR and Multiple VaRs on One Report.
See what specific products and positions in your curve are driving and reducing your risk based on scenarios
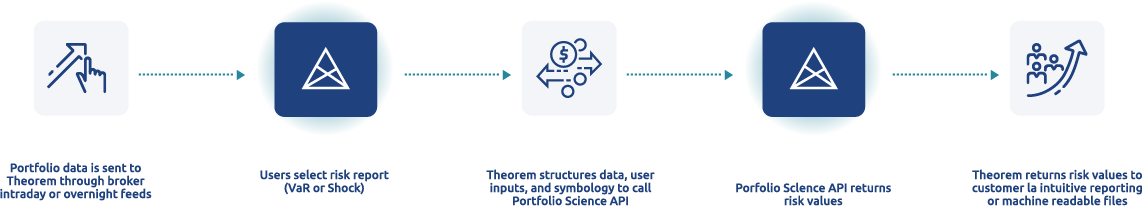
Utilizing the Power of

Theorem uses Portfolio Science to securely and quickly produce market risk analytics. There is no onboarding or transition time required because we are always plugged in and only transmit anonymous data.