![theorem-technologies-logo.png]](https://theorem.io/hs-fs/hubfs/branding/theorem-technologies-logo.png?height=40&name=theorem-technologies-logo.png)
Jump to: Group and Expand ►Customize Columns ► Switching Data ►Downloads ►Views
About Data Viewer
This article explains how to use and navigate the general Data Viewer user interface. The actual data, columns, and buttons that appear in your experience depend on settings, entitlements, and what specific Data Viewer you are viewing. See our Related Articles below if you have a specific question or problem, or check out one of these articles about specific Data Viewer types:
Intraday Trades • FX Balances • Open Positions
Group and Expand
Use the Group Bar to group by one or more columns. Drag a column heading into the Group Bar area and drop it. The grid will update and each row of the grid will be based on the unique column, or combination of columns, you have dropped in the bar.
Click the ( X ) icon in the group bar to remove a column from being grouped in the grid, or if you are grouping by multiple columns, drag the columns within the group bar to change the order of the grouping.
Some columns might not be available to be grouped. In that case, a circle with a cross will appear if you try to drag it into the bar.
If groups are present, click the expansion node ( > ) in the first column to see the detail records behind each group.
Important: Grouping and Sorting work Independently of each other.
Dropping a column to the group bar or re-ordering the groups in the group bar do not change the sort. You must click each group in the group bar to sort by that group.
Customize Columns
You can customize the columns that you see in the data grid by changing what columns are present, width, order, and sort.
Choose Columns Button
Click this button to see a list of all available columns based on the type of Data Viewer you see. Check a column to make it appear in the grid. Use the top check mark to add all or remove all columns.
Columns that you have renamed will appear in the list as your custom name, not the original name. Removing a column will remove it from a grouping if that column was in the group bar.
Work with Existing Columns
You can do many things to customize your view by clicking near the column header.
- Drag the separator between column headers to change the width of columns.
- Drag and drop the column heading itself to change the order of columns.
- Drag and column heading off of the grid to remove it. Removing a column does not remove any filters or sorts that exist on the column that you just removed.
- Click the three dots in the column and chose Rename to rename that column in the grid. The name you chose will also be the column name for some automated exports.
Sorting the Grid
To sort by one column, click it's column heading.
- Click once to sort in ascending order. An up arrow will appear in the column heading.
- Click again to sort in descending order. A down arrow will appear.
- Click a third time to cancel the sort.
To sort by multiple columns, hold down the shift key while clicking a column once (ascending) or twice (descending). The grid will immediately update and the sort number (1, 2, 3, etc) will appear in the column header next to the up or down arrow.
Holding shift and clicking another column will always add a new sort to the end. To change an existing multiple sort, hold shift and click the column to go from ascending to descending to no sort, but it is not possible to go from descending to ascending. In this case, start over with the first column.
Sorting Groups
To sort by a group, click either the group name in the group bar or the column heading of the group. Holding down the shift key allows for multiple sorts.
Groups do not have to be sorted. Click a column to order all of the groups by that column. For example, when grouping by account, click a quantity column to show all accounts in order of total quantity.
Sorting by a column that is not a group and that has multiple text values in that group will produce odd results. We do not recommend that you do this, but if you do generally the groups that have multiple values will appear first and then down the grid the groups that only have one unique value in that group will appear.
Search and Filter
There are three ways to use searching and filtering within the Data Viewer.
Type to Search
The text search bar at the top of the page works as a temporary global search. The rows in the data grid will be limited by what you type in the search bar. The search works against all columns that are selected in the grid.
The search is meant to be ad-hoc. The search term stays in effect as you switch between views, but it does not apply to report downloads and it resets every time you exit the Data Viewer.
Column Filters
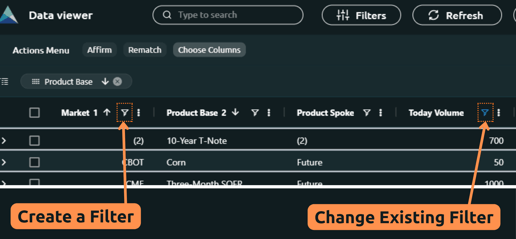
Click the filter icon in each column to set a filter that applies to that column only. You can choose between options like equals, contains, does not contain, etc..
A column that has an active filter appears blue. Click the filter icon and reset it to nothing to remove the filter for that column. When a column is removed from the grid, it's filter is still active, so keep this in mind and use the reset filter button under the Filters panel if you are not sure what your settings are.
Tip: Filter and Forget
Filter by a specific account (or product, or market, etc), re-name your view to the value you are filtering for, and then drag away that column from the grid. The filter stays active and you eliminate a superfluous column.
Filters Panel
The Filters Panel at the top of the page has different controls based on the type of Data Viewer that is present. These filters are meant to be a top level control.
The Clear Filters button is always the first option on this panel and it will automatically reset all column filters to nothing.
Refresh
Press the Refresh button at the top of the Data Grid to re-load the results you see with the newest data from the back end.
Tip: Look for Refresh Available
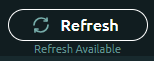
When any data changes, Refresh Available will appear just below the refresh button. If you press Refresh but you don't see the the Refresh Available label, you won't see anything new.
Status
The Status Panel appears in between the Refresh button and the Date Selection panel. The content of this panel changes based on the type of Data Viewer you are using and settings. In most cases, the panel will have a status light to indicate the status of a special feature or system, such as the matching engine.
- Solid Green means that the system is normal and indle.
- Pulsating Red means that the system is running now, such as matching new trades.
- Solid Orange means that the system has finished running and new results are available. This is an ideal time to press the Refresh button.
Date Selector
Click the Date Selector panel to chose a historical or future date to view. The Data Grid will update with the results from the date in the calendar you selected.
Future dates can apply when capturing trades from a time zone that will have a booking date for a future date, usually the next day. For example, at 2:00 PM in New York, select the date for tomorrow (or the next weekday) to see trades captured for Australian markets.
Summary
The Summary area is on the right edge of the page. Depending on the type of Data Viewer selected and other settings, different type of data will be summarized. For example, when viewing Intra-Day trades and matching is enabled, the total captured volume by source will display.
The summary totals will always reflect column filters but not the top level text bar.
Switch Data
Click the name of the repository to switch between different types of Data Viewers, such as
- Intraday Trades
- FX Rates
- Money Balances
- Cash Movements
- Open Positions
- Trade Lifecycle Events
Your account may not be set up for some or all of the different Data Viewer types. Each type of Data Viewer requires its own Data Pipeline to be set up.
Settings
If your user account has permission, click the gear icon to access the settings for this Data Viewer repository to set up matching rules, data flows, and other advanced features.
Downloading Reports and Data Exports
Click the Download Icon to see a list of available reports, set up report settings, or to quickly download the most recent report / settings as a PDF or XLSX file.
For more information, see Downloading Reports.
Local and Published Views
About Views
A view is a preset of almost all of the settings discussed in this article that can be saved or shared. The following settings are saved:
- Column names, order, width
- Filtering and sorting (on the column level)
- Group settings
Local Views
Each tab on the bottom of the page is a local view that is saved as a preference for your local account. The highlighted tab is your current view. To switch between views, click another view. If you have more views than are visible on the page, use the left and right ( < > ) buttons to slowly scroll or click in between the tabs and drag to the left or right to quickly scroll.
While hovering over a local view, options appear above that allow you to manage it.
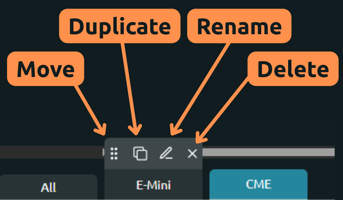
- Use the handle icon to grab the view and drop it in between others. This allows you to re-order your local views.
- The duplicate icon will clone that view's settings as a new view.
- Rename the view using the pen icon.
- To remove the local view, press the X icon on the right side of the hover menu. The local view will immediately delete.
No one else can see your local views, but you can share them by creating a Published View.
Published Views
You can use a published view to save and share your local views as a published artifact, or to access the published views that others have created.
Every person that has access to the repository can access the published views.
Saving a Published View
Click the Save view as button to publish your current local view. After you provide a name, that view will appear in the Select view .... list box in the lower right of the Data Viewer.
Click or search the list box to see the available published views, including the ones created by you and others. Click on a published view to duplicate the published version as your own local copy. Once a view is copied locally, any changes that you make to it will only apply to your local view. Published views can also be thought of as templates because once you select one, you are free to change it without it changing the published version.
Related Articles
Many of the topics covered in this article are discussed with more depth in related articles. To explore more key concepts:
Other Related Articles